Operational dashboards
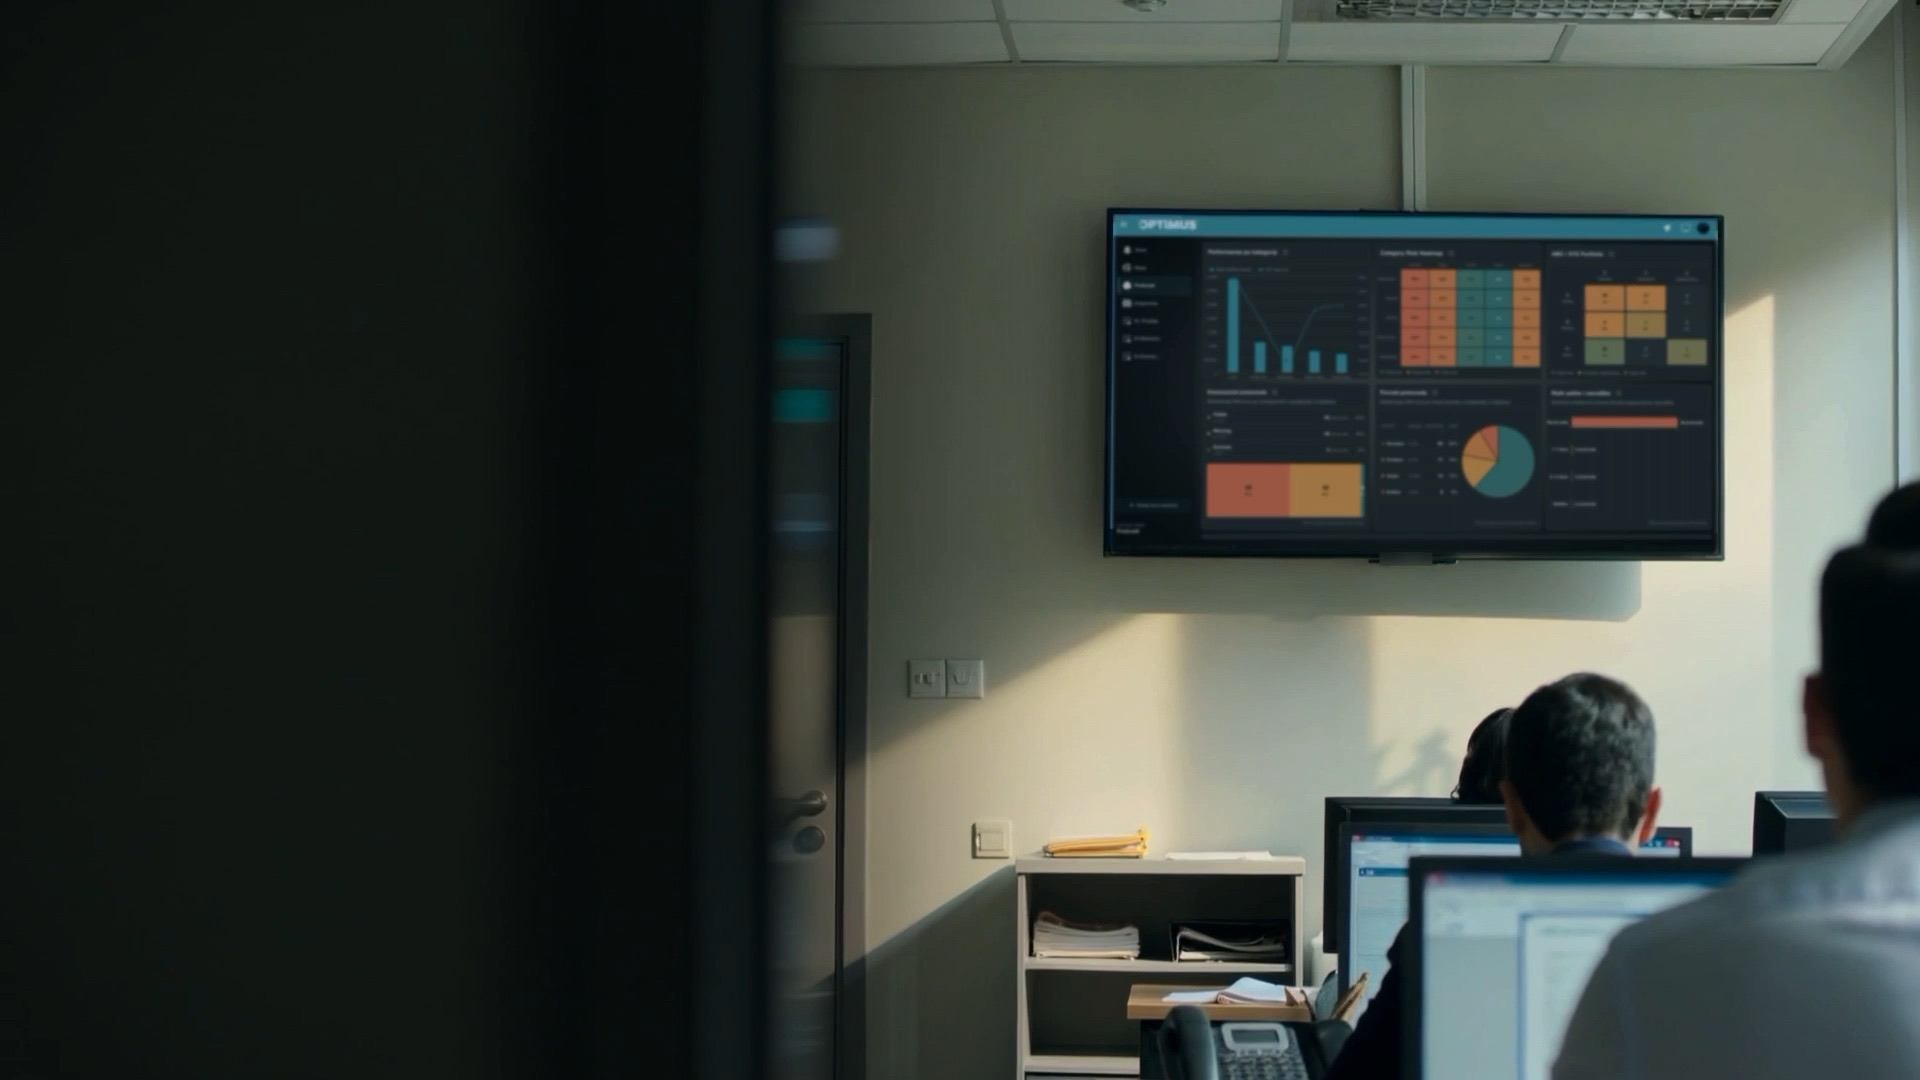
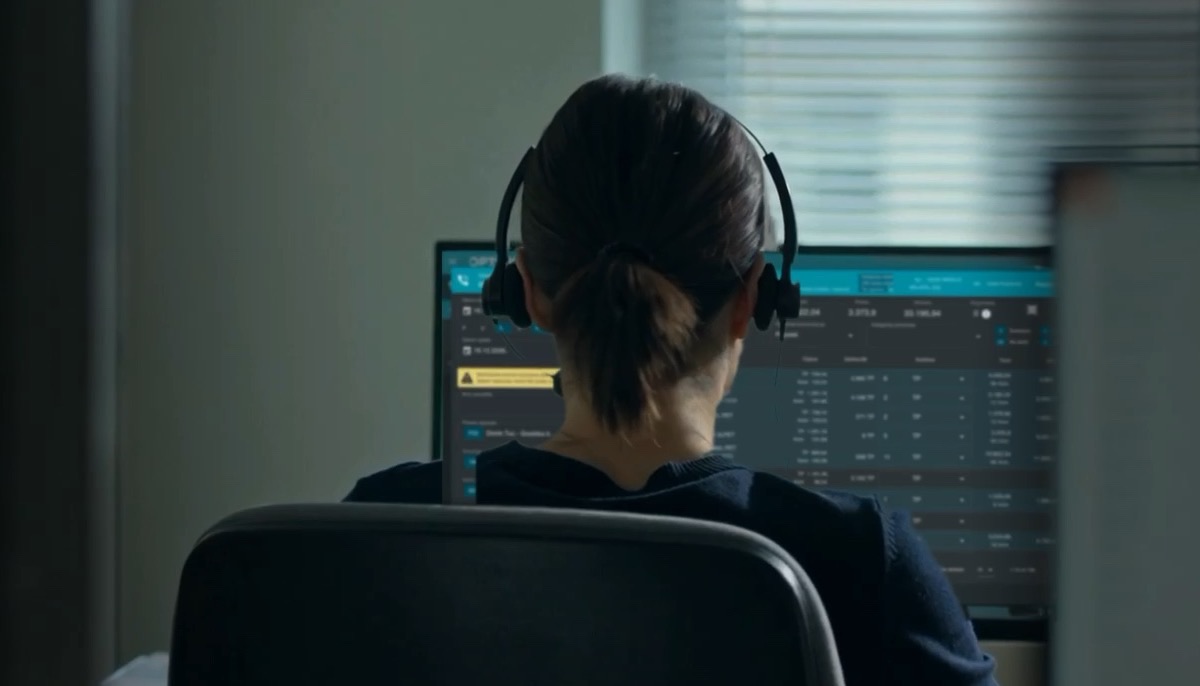
Follow sales, fleet and delivery activity as it happens — one view of the day, not five spreadsheets.

REPORTING & BUSINESS INTELLIGENCE
Turn daily operations into decisions. Reporting & Business Intelligence brings sales, fleet and delivery data together in one place, with dashboards and reports built on the same numbers your teams work with every day.
Request a demoCAPABILITIES
Operational dashboards · Live TV dashboards · OPTIMUS Pulse recommendations · 100+ role-restricted reports · Sales analytics · Fleet & cost reports · Delivery performance · Data exports · ERP-consistent figures
Follow sales, fleet and delivery activity as it happens — one view of the day, not five spreadsheets.
See revenue, orders and visit effectiveness by rep, customer, territory and product, straight from field activity.
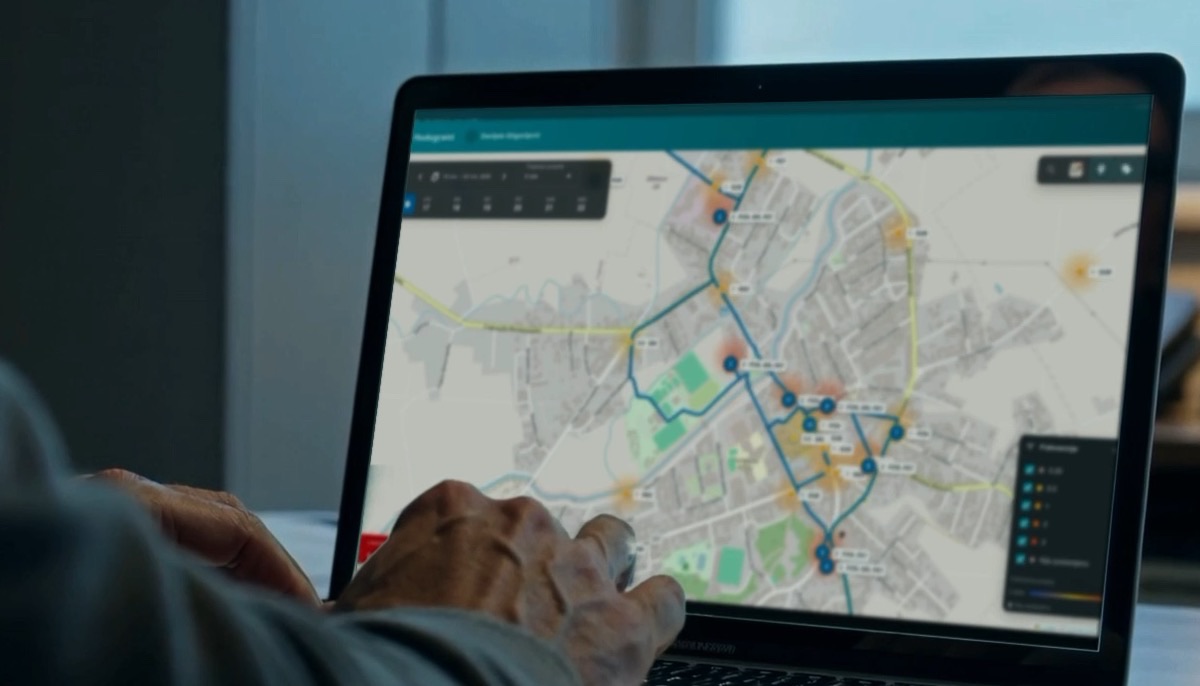
Pulse reads your own past records — sales, stock, visits and deliveries — and recommends what to do next: where a product should be sold, what is likely to run out, which orders to pre-create, and which products are gaining or losing ground.
Put the day's performance on the office TV or wall display and mirror it across every office — each screen showing its own territory, depot or team, refreshed as the work happens.
A library of over 100 pre-built reports across sales, customers, products, fleet, delivery and finance — each restricted to a user role and limited by the viewer's access level, from their own work to the whole group.
Track fuel, mileage, service and cost per vehicle or per route, so fleet spending is never a surprise.
Measure on-time delivery, proof-of-delivery completion and settlement speed across every route.
Export any report to MS Excel or PDF to share or analyse further — the same figures, wherever they go.
Reports are built on the same data that flows to and from your ERP, so the numbers always match.
OPTIMUS PULSE
OPTIMUS Pulse reads the records your teams already make — visits, orders, stock counts, deliveries — and turns them into recommendations: where a product should be sold, what is likely to run out, which orders should be pre-created, and which products are gaining or losing ground. Nothing is invented; every suggestion points back at the history it came from.
Where a product actually sells, and where it should sell too — the gap between the stores carrying it and the stores beside them with the same profile.
Sell-through measured against shelf stock flags the locations likely to run out before the next visit lands.
Accounts ordering below their own history get a draft order built from their average, the season and the promotions running.
Weekly movement per product, so a line that is rising is pushed while it still is, and one that is falling is caught early.
Which products earn their place at a location, and which should come off the product list there.
Illustrative territory and records — what Pulse reads, the thresholds that raise a recommendation and the value behind each one follow your own data.
Week 44 · October 2026 · read from 18 months of records
Nova 1.5L glass +31.3% over 8 weeks · Bili 0.33L can -24.5%
Recommendations raised this week
Sells in 41 of 68 stores; 6 nearby stores with the same profile carry it on no product list
3-week sell-through against shelf stock leaves 9 stores under one week of cover
Average order 62 units; the last three visits averaged 38
Sells under 2 units a week at 11 of the 22 stores that carry it
Warm weeks lift chilled sales 38% at the locations running a cooler
3 accepted · €3,520 in motion · 2 awaiting review
LIVE TV DASHBOARDS
Live TV dashboards put the day's performance on the office screen — orders booked, visits closed, deliveries handed over and vehicles on the road — and mirror it to every office, each showing its own territory, depot or team. The numbers move as the work happens, so the whole room is looking at the same picture at the same time.
The board runs full-screen on an office TV or wall display. Nobody opens a report — the numbers are already up.
The same board is mirrored to every office, each one showing its own territory, depot or team from the same figures.
Tiles, bars and lists refresh as the work lands: orders confirmed, visits closed, deliveries handed over, vehicles moving.
Sales, dispatch, fleet and the call centre each get their own screen, all built on the same operational data.
A stock-out, a late route or a reefer out of tolerance interrupts the rotation with the number behind it.
Illustrative day and offices — the tiles, layouts, refresh rate and the screens each office shows follow your own data.
Group · all offices · Tue 21 October 2026
Booked by hour vs plan
Live by rep
I. Petrović leads at 112% of target
Mirrored in 6 offices
All KPIs & hourly pace
€79,300 bookedVisits & orders by rep
88 / 112 visitsRoutes, loads & exceptions
24 routes liveAvailability & promotions
94.2% in stockVehicles, cold chain & service
47 on the roadCalls, orders & queue
312 calls takenTIME-BASED REPORTING
Some questions come back at the same time every day: how much have we sold by morning coffee, by midday, at day close? Time-based reporting generates the report automatically at each set period and sends it by email — the same template, the current figures, the people who need them.
Set the periods once — every morning, every midday, every day close — and the report is generated automatically at each one.
Each send runs the same template against the live data, so 08:00, 12:00 and day close are directly comparable.
The finished report lands in the inbox as a PDF or MS Excel attachment — no one has to open a dashboard to see it.
Each scheduled send goes to the roles that need it, with the figures limited to their access level.
Illustrative schedule and figures — the periods, reports and recipients follow your own working day.
Generated automatically · sent by email
REPORTS LIBRARY
The platform ships with a library of over 104 pre-built reports covering sales, customers, products, fleet, delivery, finance and management. Every report opens for everyone — what changes is the data inside. The figures are limited to the viewer's own clients and employees, from their own work up to the whole group.
Sales, customers, products, fleet, delivery, finance and management — the reports already exist. You open them, you don't build them.
No report is locked behind a role. A sales agent, a fleet manager and the finance team can all open the same report.
What changes is the data inside: everyone sees the figures for their own clients and employees — their own work, their team, their territory, a region or the whole group.
Every report exports to MS Excel for further analysis or to PDF for sharing and signing off — the same figures, wherever they go.
Every report is built on the same operational data as the dashboards, so a number means the same thing at every level.
Illustrative catalogue — the reports and data scopes follow your own organisation.
104+ reports · 7 categories
| Report | Data scope | Cadence |
|---|---|---|
| My day — visits & ordersSales & orders | Own work | Live |
| Team target realizationSales & orders | Team | Daily |
| Key account scorecardCustomers & territories | Territory | Weekly |
| Availability by store clusterProducts & availability | Territory | Daily |
| Fuel & cost per vehicleFleet & costs | Region | Monthly |
| Delivery cost per locationDelivery & warehouse | Region | Weekly |
| Credit exposure & overdueFinance & credit | Group | Daily |
| Group P&L by channelManagement & KPIs | Group | Monthly |
ONE PLATFORM
Each solution stands on its own and runs on the same data, so the rest of your operation is one step away.
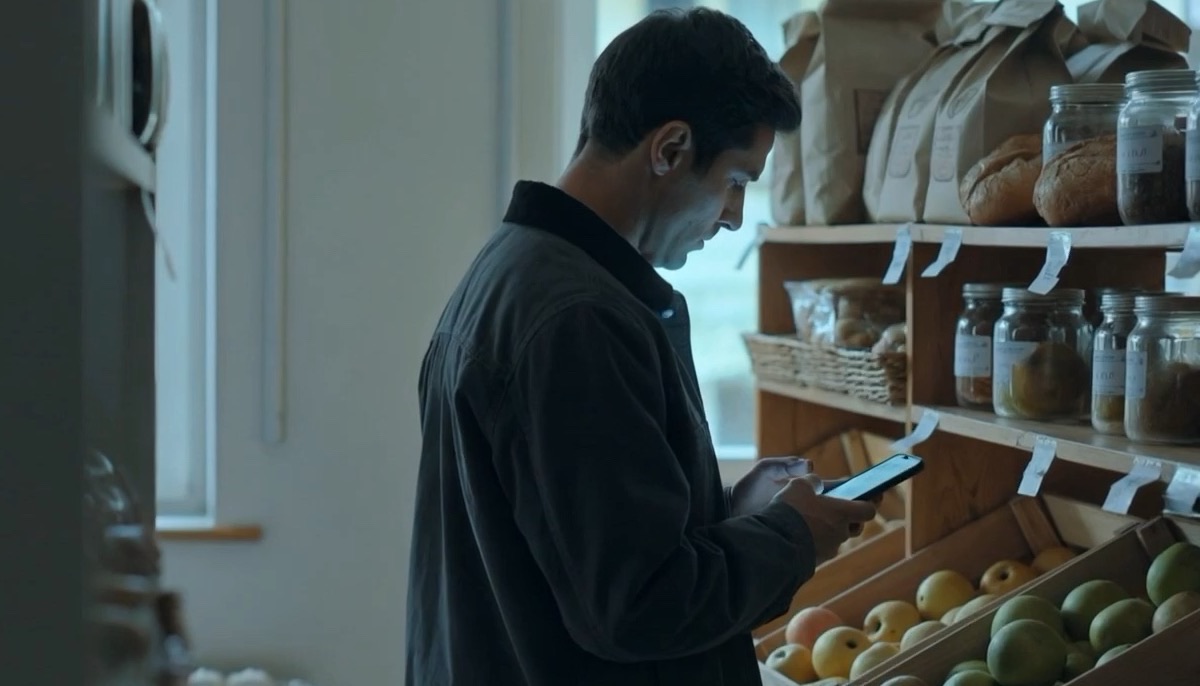
All activity at the client's location, managed in one app.
Explore this solution
Routine approvals, checks and alerts handled automatically.
Explore this solutionLET'S MOVE FORWARD
Request a demo and see what connected operations could look like for your business.